[vc_row][vc_column][vc_column_text]
- EURGBP uptrend momentum is fading on RSI, reversal ahead?
- Net-short EURGBP positioning still offers a bullish trading bias
- EURGBP 4-hour chart warns of a test to come at rising support
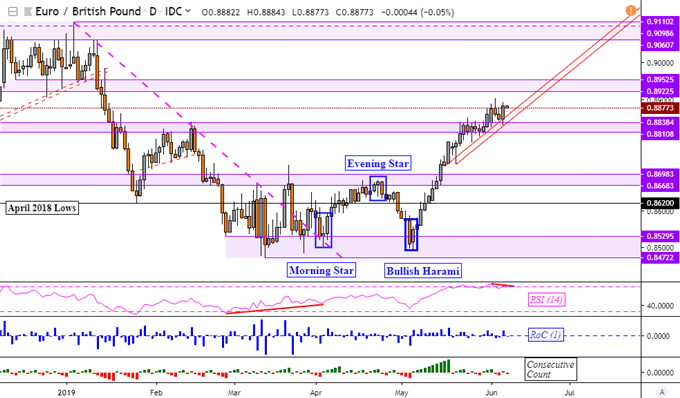
As of late, the EURGBP uptrend has slowed after the psychological barrier between 0.8811 and 0.8838 was taken out. But, it appears that it left a mark on the currency pair.
As EURGBP approaches the next major resistance level, which is a range between 0.8923 and 0.8953 on the chart below, keep an eye on support. That would be a rising channel going back to the middle of May highlighted in red below. Meanwhile, negative RSI divergence warns that upside momentum is fading. This can lead to a turn lower ahead.
Zooming in on the 4-hour chart to take a closer look at near-term behavior, an area of resistance appears to have established itself at 0.8888. Negative RSI divergence is also present here. If this area were to be taken out, that would open the door to testing key resistance noted earlier. Otherwise, a descent through 0.8811 exposes 0.8698.
[/vc_column_text][/vc_column][/vc_row]

